Power BI Analytics
VISIBILITY OF PROCUREMENT SPEND AND GLOBAL SUPPLY CHAIN RISKS
SUMMARY
The Siecap Analytics Team assisted a large multinational mining and metals processing company in mapping their annual procurement spend by leveraging data and implementing new capabilities to provide a fully integrated and interactive Power BI procurement spend dashboard that provides analysis and insights to drive communication and decision making for the business.
The integration capitalised on existing capabilities within the business and automates future data updates to seamlessly refresh the dashboard, allowing shared critical insights into procurement throughout the business.
OVERVIEW
To produce the insights necessary on procurement spend, the business previously required Information & Technology professionals to extract extensive data sets from internal ERP systems, followed by time consuming analysis which could take weeks or months to produce a result.
With the current regulatory climate, demanding regular and prudent disclosure of business risks (including procurement), coupled with the economic imperative for up-to-date insights, access to a more efficient and effective means of analysing vendors was essential.

Validated, cleansed and analysed data to align with current financial spend

Designed, developed and implemented a centralised interactive Power BI dashboard

Assisted with publishing the dashboard within the organisation to allow sharing, communication and collaboration within the business.
THE SOLUTION
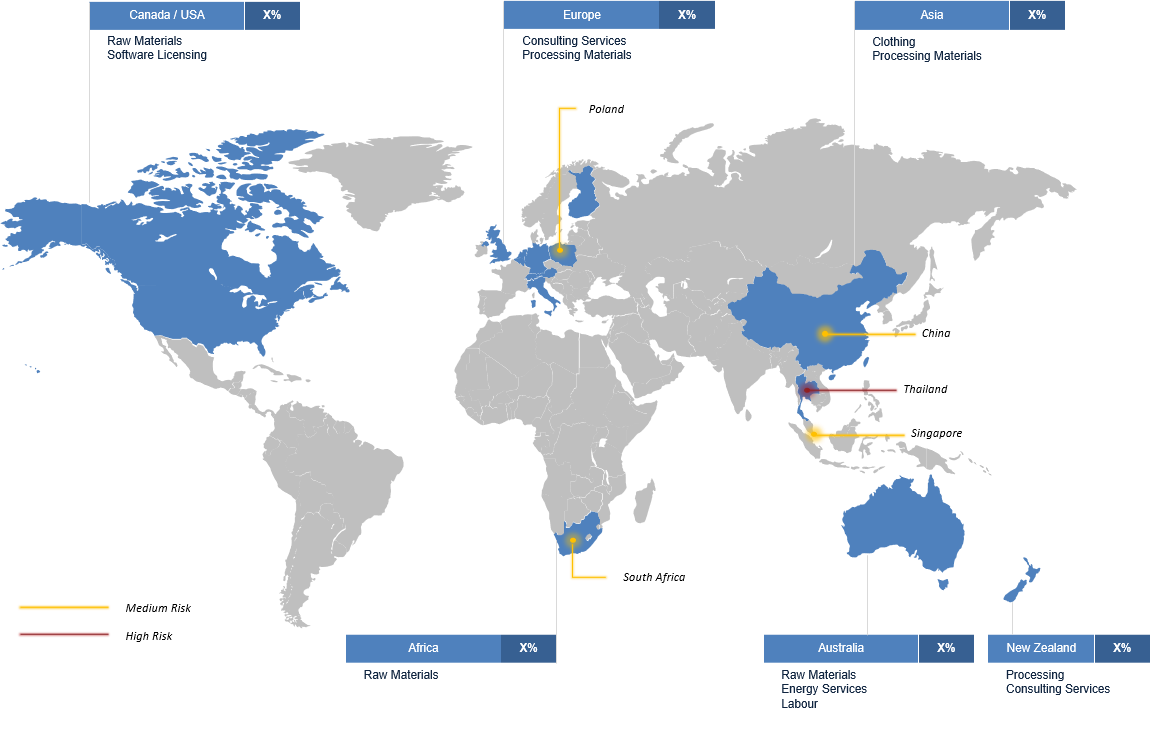
Utilising Power BI, the Siecap Analytics Team mapped the client’s supply chain and created a spend analytics dashboard which collated spend distribution across vendors, products and regions.
Information from multiple business units was transformed, manipulated, and combined to create a central platform which provided visibility into the full suite of the business’s procurement spend. In turn, the outputs of this data provided key insights into the spend and highlighted inefficiencies for further analysis.
This enabled clear and concise communication of these findings to internal stakeholders and set the stage for the next steps in rationalising spend and optimising vendor engagement.
Classification and interrogation of spend across a multitude of areas included:
- Vendor activity
- Key jurisdictions
- Product origins
- Contracted vs non-contracted purchases
- Product lead times

Shared visibility into supply chain parameters assisted in driving improvement through:
- Cost reduction
- Supply consolidation
- Reduced risk
- Improved vendor management
- Reduced annual procurement spend
- Legislative compliance maintenance
CONCLUSION
The outputs from this spend analytics dashboard improved the decision-making processes within the procurement team and assisted the company in becoming better informed in both their economic rationality and supply chain compliance. The project has benefited the organisation by improving the effective management of vendors, reducing annual procurement spend and enabling the business to identify and mitigate risks, setting them on the path to maintain compliance with the Modern Slavery Act 2018.
Beyond creating a capacity to simply communicate critical information, the visibility into procurement spend assisted collaboration across the business’s organisational functions.